What Credit Unions Spend on Marketing
2025 benchmarks for every credit union over $250M, built from 100,000+ call reports and the budgets we manage.
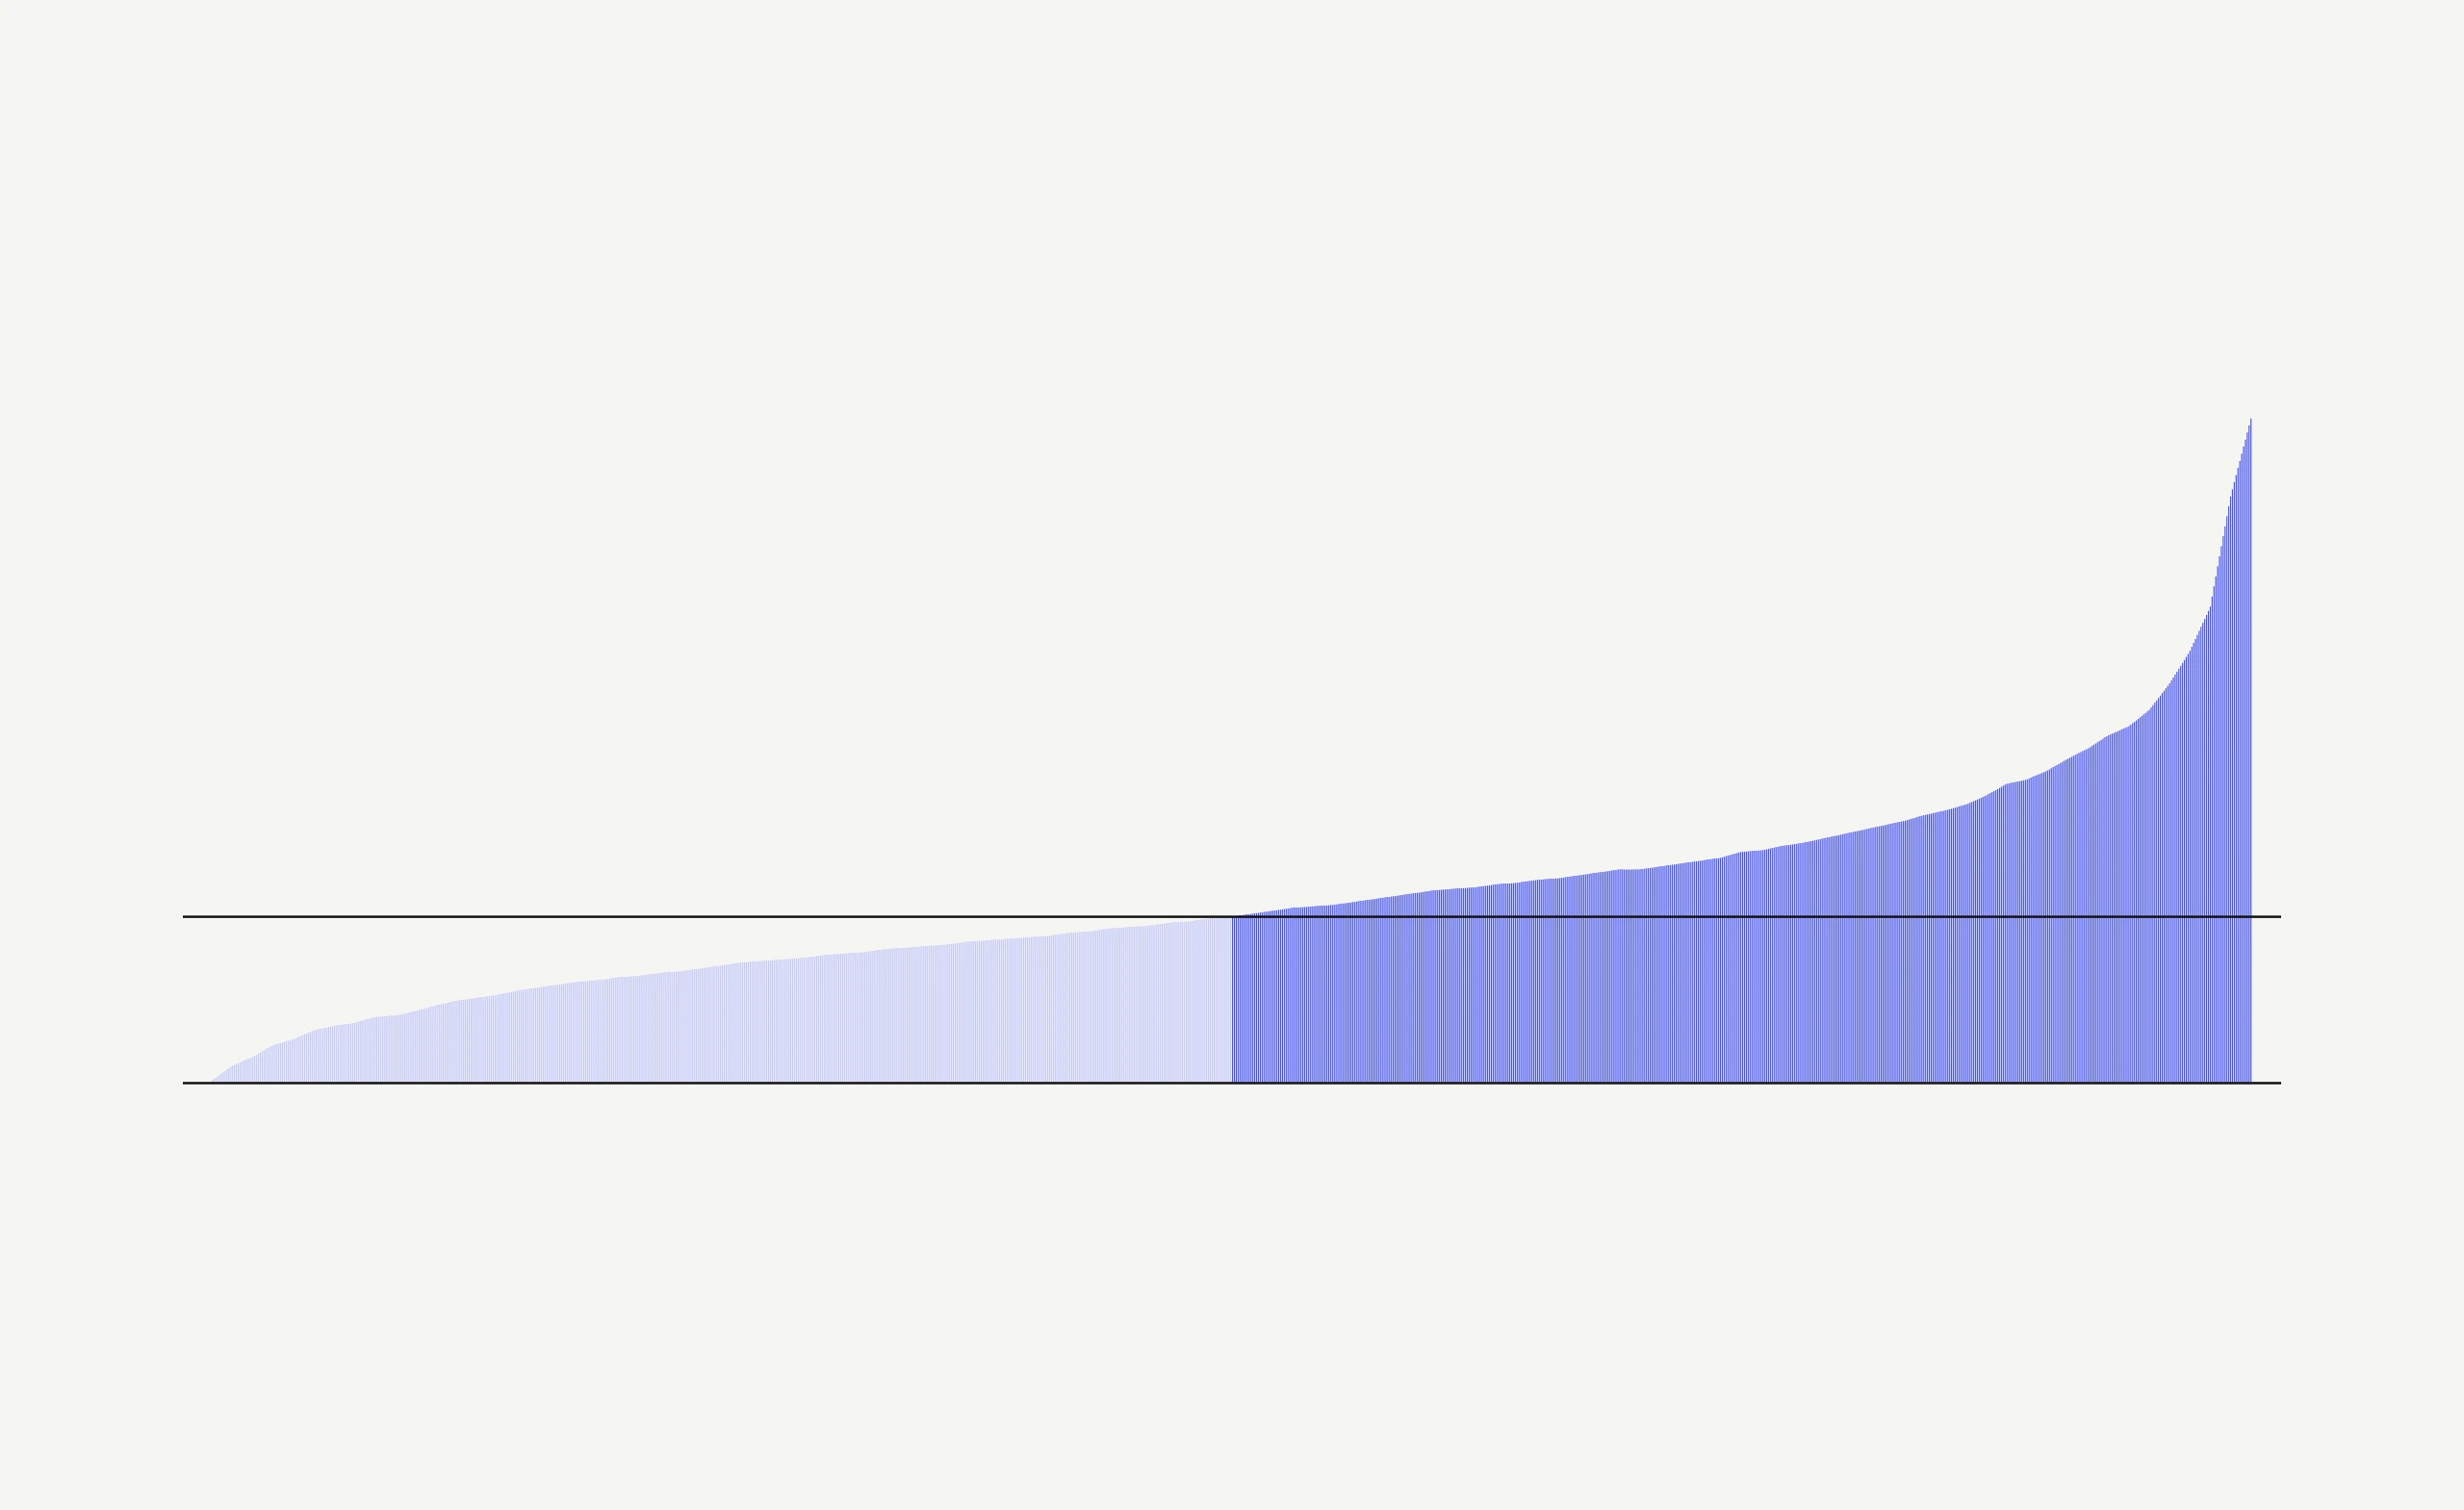
The typical credit union over $250M puts about 0.11% of its assets into marketing each year. That’s about $1.1M a year for every $1B in assets.
To benchmark credit union marketing budgets, we analyzed more than 100,000 call report filings from 5,300+ credit unions and 5,300+ banks, December 2019 through June 2026. We stripped out mergers, tested the link between spending and growth four different ways and checked the results against the budgets of the 20+ credit unions and banks we work with. See how we built it.
Find your credit union’s marketing budget.
Search by name or city to see what a credit union spends on marketing and how it compares with peers.
What peers your size spend.
Asset-size calculator
Slide to your asset size
- Low end
- $1.56M 25% spend less than this
- Typical
- $2.34M Half spend more, half less
- High end
- $3.23M 25% spend this or more
- Top 10%
- $4.14M 10% spend this or more
- That’s about $195K a month for a typical credit union your size.
- Reaching the top 25% takes about $888K more a year.
- The top 10% spend about 4 times what the bottom 10% do.
Based on 93 credit unions with $1.6B to $2.5B in assets, 2025 call reports. Marketing is about 3.4% of their operating expenses.
Every credit union over $40M, 2025. Drag across the chart to change size, or hover a dot for details.
Where the money goes.
About 4% of operating expenses go to marketing
Each square is 1% of operating expenses at credit unions over $250M, 2025. Hover or tap any square to see what it covers.
- Staff pay and benefits53%
- Office operations18%
- Professional services9%
- Loan servicing6%
- Occupancy6%
- Everything else4%
- Marketing4%
Spending more goes with growing faster.
Above $500M, bigger spenders grew members faster in every size group
Member growth a year, 2022 to 2025, by spend compared with the median for their size
The pattern held up under tougher tests. Within the same credit union, a year of higher spending was followed by faster member growth, about one percentage point for every extra 0.10% of assets, on average. Fast growth, on the other hand, didn’t lead to bigger budgets. Deposits grew faster too, and profit held steady: return on assets stayed near 0.7% at every level of spend.
The first dollars do the most. Below the median, each extra dollar went with more than twice the member growth it did above it. So once you’re at the median, the next dollar should go where you can measure what it buys.
What a new member is worth
The member you add matters as much as the count. A primary relationship with checking and a loan pays back far sooner than a rate shopper.
Peers are raising budgets.
Spending has climbed every year since 2020
Total marketing spend, all federally insured credit unions
Credit unions spent $2.98B on marketing over the 12 months to June 2026, about $8M a day. That’s up 61% since 2020, or 30% after inflation, and faster than assets grew.
The biggest credit unions raised budgets the most
Median change in marketing spend from 2024 to 2025, and the share of credit unions that cut
Banks spend about half as much.
The gap holds at every size
Median marketing spend as a share of assets, 2025
Banks only itemize marketing on the call report when it tops $100,000 and 7% of other expenses, so the typical bank spends even less than the figures above. Reporting banks have held near 0.06% of assets since 2020.
What the best budgets have in common.
We see the ad, analytics and application data behind our clients’ budgets side by side. The ones that drive growth share four habits.
They know what a member is worth.
They set the most they’ll pay for a funded account, product by product, and hold every channel to it.
They count each outcome once.
A completed application or a funded account, counted once. Clicks, page views and form starts help tune a campaign, but they aren’t the goal.
They fund their best products first.
The products that pay back fastest get the budget first, instead of spreading it evenly across everything on the rate sheet.
They watch the hand-off.
The jump from an ad to the application platform is where most journeys stall and most tracking goes dark. Fixing it often does more than adding budget.
Build the foundation, then scale.
Get the full funnel working before a budget grows. Sometimes the smartest move is spending a little less for a quarter and putting that money into the foundation.
Build the foundation
First 60 to 90 days
Get these working before you add spend.
- Tracking and analytics
- Brand and messaging
- Creative for every stage
- Website
- Application experience
- Full-funnel campaigns
Prove it
The next quarter
Run the full funnel on one or two priority products. Learn what a funded account costs and what it’s worth, then set the most you’ll pay.
Scale what works
Ongoing
Add budget while that cost holds. Credit unions over $2B that grow members 4% or more a year spend a median 0.13% of assets, and 25% of them spend 0.18% or more.
Before you set the budget.
How much should a credit union spend on marketing?
Credit unions over $250M spent a median of about 0.11% to 0.12% of assets on marketing in 2025, or $17 to $22 per member, depending on size. That’s $367K a year at $250M to $500M and $3.35M at $2B to $5B. Fast-growing credit unions spend more.
How much of a credit union marketing budget goes to advertising?
NCUA call reports combine advertising with other educational and promotional expenses in account 270. To calculate your credit union’s paid media share, divide paid media spend by total marketing spend for the same period using your internal budget.
What share of operating expense goes to marketing?
About 4% across credit unions over $250M, ranging from 2.8% at $250M to $500M to 4.7% at $5B to $10B. Staff pay and benefits take about 53%.
Do credit unions that spend more on marketing grow faster?
On average, yes. Above $500M, credit unions that spent more than the median for their size grew members faster in every size group, and the link held when we compared each credit union with itself over time. Growth per dollar slows above the median, so how the money is spent matters as much as how much.
What counts as marketing expense on the call report?
For credit unions, NCUA account 270, educational and promotional expense, which covers advertising, publicity and promotions. Marketing salaries and some agency or software fees are booked elsewhere, so true budgets run higher.
What percentage of assets should a credit union spend on marketing?
Credit unions over $250M spent a median of about 0.11% to 0.12% of assets on marketing in 2025. The top 25% spent about 0.15% or more, and fast-growing credit unions over $2B spent a median of 0.13%.
How much does a $1 billion credit union spend on marketing?
Credit unions with $1B to $2B in assets spent a median of $1.55M on marketing in 2025, and the middle 50% spent $1.12M to $2.19M. That’s about 0.12% of assets and 3.4% of operating expense.
How do you calculate a credit union marketing budget?
Start with your peer group’s median share of assets: 0.10% of assets is $1M a year for every $1B. Check it against marketing’s share of operating expense, which runs about 3% to 5%, then adjust for your growth goals and how well you can measure results. The calculator above does the math for any asset size.
How much do banks spend on marketing compared with credit unions?
Banks that report marketing on their call reports spend about 0.06% of assets, roughly half the 0.11% to 0.12% credit unions spend at the same size. Banks only report it above a threshold, so the typical bank spends even less.
About this research
How we built the benchmark
- 100,000+
- call report filings analyzed, December 2019 through June 2026
- 5,300+
- credit unions, matched filing by filing over six and a half years
- 5,300+
- banks, for a side-by-side comparison at every size
- 4 tests
- of whether spending is tied to growth
- CollectEvery NCUA 5300 and FFIEC call report filing in our window, matched institution by institution and year by year.
- CleanMid-year filings annualized, merger-driven jumps removed, and every credit union compared only with peers its size.
- TestThe spend and growth link checked four ways: with controls for size, low-income designation and region; within each credit union over time; for which came first; and with 2022 spend against later growth.
- CheckPublic numbers compared with the ad, analytics and application data of the 20+ credit unions and banks we work with.
Sources and definitions
Benchmarks cover the 1,104 federally insured credit unions over $250M that reported marketing spend in 2025. Credit union marketing is NCUA account 270, educational and promotional expense. Bank marketing is RIAD 0497, advertising and marketing expense, which banks report only above a threshold. Growth comparisons drop any credit union with a one-year jump in assets or members above 30%, which usually signals a merger.
Related perspective: How to name a credit union.
Want a second look at your budget? We help credit unions and banks connect marketing spend to members, deposits and loans. Explore our credit union work, see our bank work or talk with our team.
Let’s talk.
Interested in working with us? Ready to start a project? If you’re excited, we’re excited. Drop us a line to start a conversation.
"*" indicates required fields